How to run AcquiObli
In this section we briefly describe how to run AcquiObli as a stand-alone application, and as a matlab toolbox. First we present a simple dataset (which can be downloaded from the free-download area on our web site). Then we explain how to load data from files. Finally, we explain how to compute the analyses.
Dataset analysed in this tutorial
A sample of 2000 participants answered to a questionnaire of seven items; the response format is 5-point Likert. Items 1 ,3 and 6 are markers for acquiescence, whereas items 2, 4, 5, 7 are the items of a scales intended to measure a single ‘content’ trait. Items 2 and 7 are reversed.
AcquiObli loads the data from text files. To replicate our analysis, you should down load the file data_example.dat. This is a text file that contains 7 columns of data (one column for the responses of participants to each item). Figure 1 shows an extract of the information contained in the file.
Figure 1. Short extract of data contained in file SAS2015.dat
4 3 2 2 3 2 5
2 2 4 2 3 2 3
2 2 3 3 3 4 3
etc
As can be observed in the figure, numerical values must be used to code the information for each individual. The data must also be separated with a white space.
To load data from files:
Data can be loaded from text files, but also from Matlab data files. The video below shows how to load the three text files presented in the section above.
As you can see in the video, the data is loaded from a text file. After loading the dataset, you should define the items that are markers for acquiescence (items 1, 3, & 6 in our example), and the content items that are reversed (items 2 & 7 in our example). In addition, you could select some items to be not included in the analysis. Once the dataset has been loaded, we advise you to save the information in a Matlab data file: this data file can be loaded in the future so that the data can be reanalysed. The last steps in the video show you how to save data, and how to load it.
How to analyse datasets
The following video shows how to analyse a dataset.
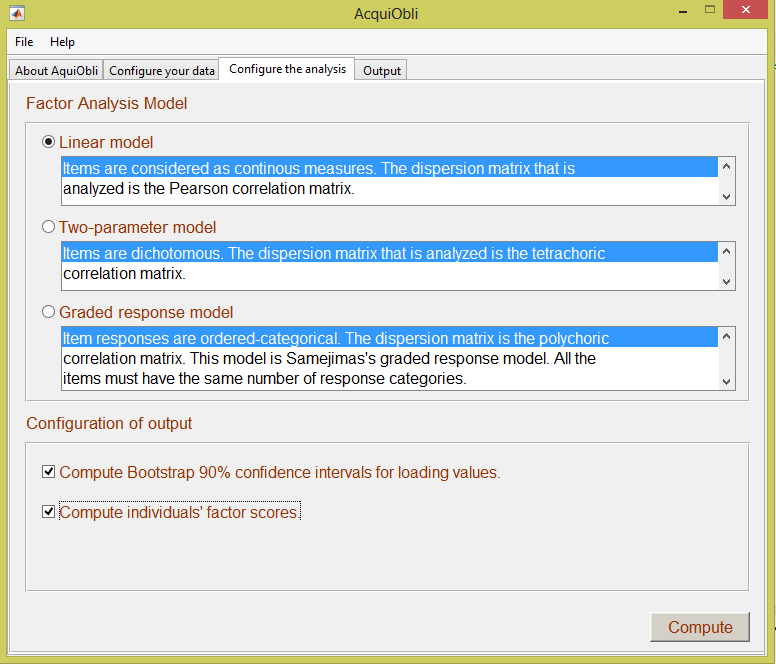
In the video, we analysed the dataset using the Factor Linear model. In addition, we selected to compute Bootstrap 90% confidence intervals for loading values, and to compute individuals’ factor scores. If you decide to analyse this dataset using the Graded Response Model, please note that it can take a certain time to finish the analysis depending on the computer capabilities. In order to compute the analysis, click on the button Compute. Finally, the video shows how to explore the output, and how to save it as a text file.
Figure shows what AcquiObli looks like after this configuration. In order to compute the analysis, click on the button Compute.